Introduction
PathAI’s core engineering work is built around scheduling, running, tracking, and otherwise managing compute jobs, usually as part of a machine learning pipeline. For Machine Learning Scientists and Engineers, the ability to experiment with data in a workflow without having to wrangle with underlying infrastructure (like monitoring or instrumenting metrics) while still having good observability into how their code is running is crucial to their projects going smoothly.
Collecting metrics about how code runs is not a new idea, but most expertise is geared towards collecting and observing information about forever-running (usually web) services. What if you want to monitor finite, on-demand workflows, jobs, or data pipelines?
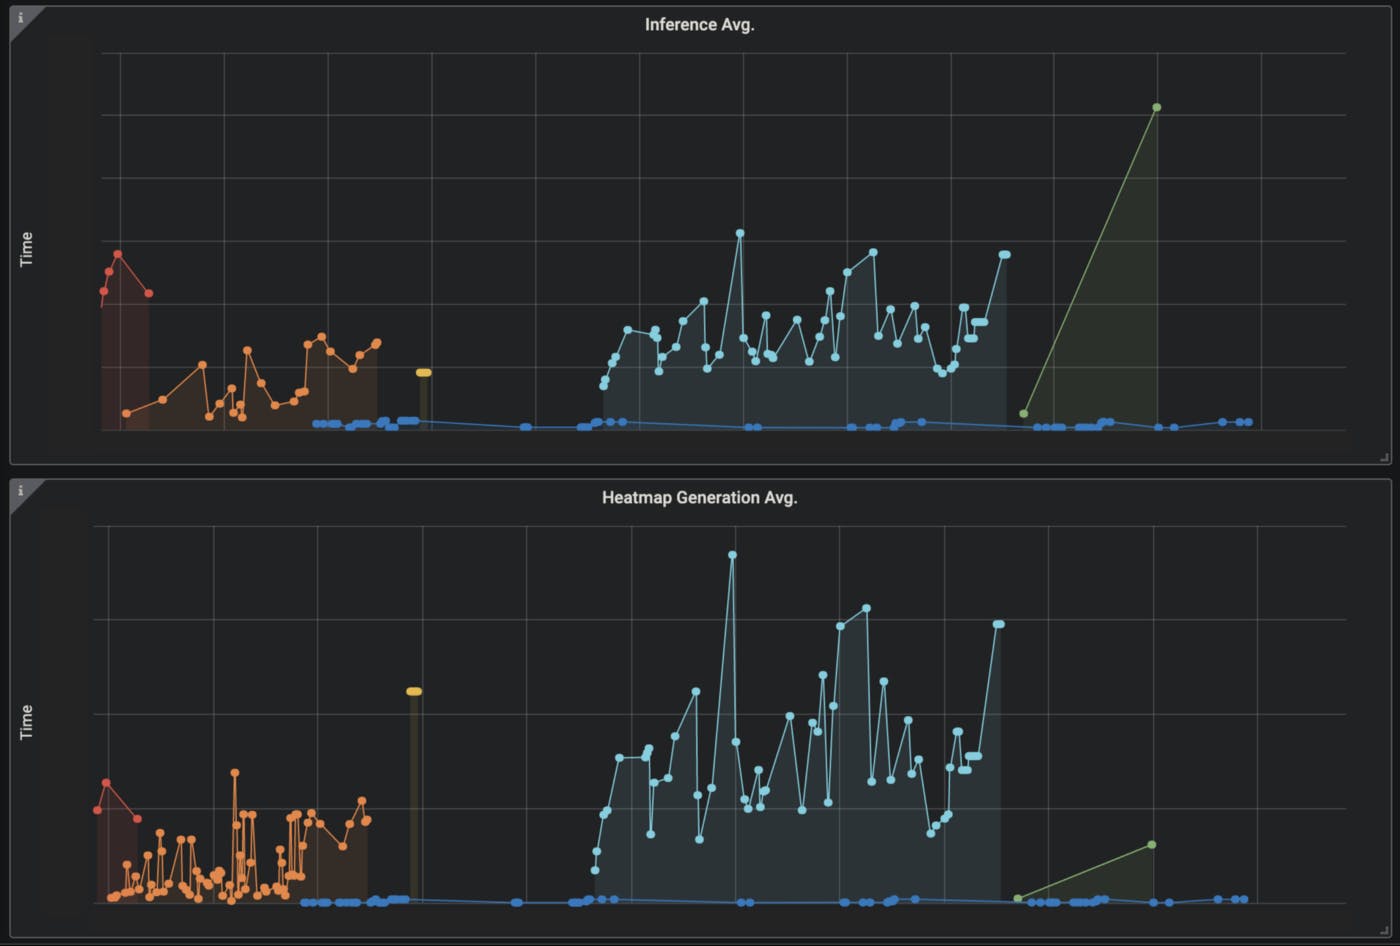
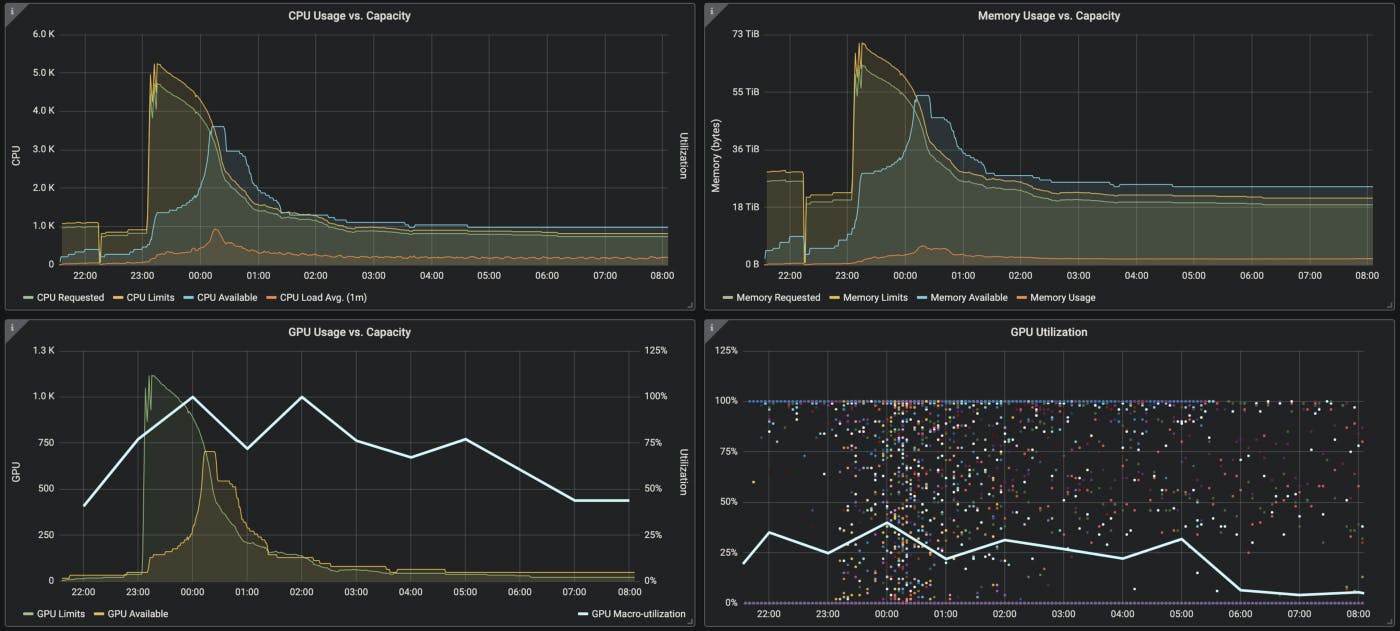
In this article, we provide a summary of how PathAI adopted existing technologies to give our developers the ability to measure things like training time, memory usage, data throughput (or almost anything) in a self-service way, and ultimately produce visualizations like this.

Getting Started
A recent development in the industry is the meteoric rise of Kubernetes. From almost every perspective (Data, Platform, or ML Engineer), Kubernetes makes sense to adopt for batch work because of its fine-grained resource control, scheduling, and reliability enhancements. PathAI was already making heavy use of containers, so it made sense to adopt Kubernetes for our ML workloads.
The Kubernetes movement has also done a fantastic job of developing monitoring and metrics tooling that’s easy to integrate, feature-rich, and is relatively painless to adopt. Prometheus is the technology leader in this space, providing both a capable time-series database (TSDB) for on-demand metrics storage and consumption, a rich query syntax, useful add-ons, client libraries for many languages, easy integration into Kubernetes, and even an alerting platform called Alertmanager.
Prometheus allows us to collect the data, but what about displaying it? Prometheus does come with a UI, but it is designed for people to test PromQL and doesn’t have the ability to build rich, interactive dashboards that can be saved for later. For this, Grafana is a natural choice. It has strong integrations with Prometheus as a data-source, is very feature-rich and flexible, and building and saving dashboards with it is easy to learn. Now that we have our technology choices, we can start building a platform that makes it dead simple for any PathAI engineer to collect metrics directly from their code.
Sampling Runtime in Jobs
For batch processes, creating and saving metrics ends up being a little more work than metrics collection for long running services would be, mainly because Prometheus is “pull-based” rather than “push-based”. In other words, Prometheus expects to find some web endpoint exposed by your code where it can read in some data at its leisure. A batch process, on the other hand, lives, does its work, and then dies, and can’t be bothered to wait for a metrics platform to find an endpoint it’s exposing to collect information. Prometheus provides a solution for this with Pushgateway; a component that will cache metrics pushed to it for later consumption by Prometheus.
The crux of the work was then building a library into our ML code that easily allowed a developer to add a few lines and get a metric pushing to Pushgateway. Below is a walkthrough of what the work entailed.
Building the Helper Library
Firstly, setting up a connection with Pushgateway involved establishing a client connection and instantiating a “Collector Registry” that would receive metrics we produced in code. Our batch job logic exists as Python, so we placed the following in a Python module that we would expect to be imported wherever anyone wanted a metric.
import prometheus_client

# Pushgateway endpoint, defaults to production Prometheus.
PUSHGATEWAY_URL = os.getenv('PROMETHEUS_PUSHGATEWAY_URL', 'https://production-pushgateway.our.services.com')

# Set up a registry for pushed metrics.
registry = prometheus_client.CollectorRegistry()
Next, we wanted to define a relatively easy way to define an actual metric. Prometheus has several types of them, and if we had stopped here, a developer would have had to learn about the various metrics types and find one in the Python client library that fit their use case. However, we elected instead to build a helper method to deal with the minutiae of shipping a metric, without forcing the engineer to remember the intricacies.
def generate_push_metric(metric_type, name, description, labels=None):
      """Creates a Prometheus metric for Pushgateway.

      Args:
          metric_type: Supported prometheus_client metric. Counter, Gauge, Summary, Histogram, Info, Enum.
          name:        Metric name.
          description: Metric description.
          labels:      Metric labels. Default is None.
      """
      # Figure out labels.
      default_labels = ["my-default-label"]
      default_metric_name_prefix = "pathai_"
      labels = default_labels + labels if labels else default_labels

      # Get the invoked metric class from Prometheus.
      metric_class = getattr(prometheus_client, metric_type)

      # Create the metric.
      return metric_class(
          "{}_{}".format(default_metric_name_prefix, name),
          description,
          labels,
          registry=registry,
      )
Each metric expects some basic information, such as the type of metric and some descriptive meta information Prometheus accepts. This helper method gives us the ability to do a few quality-control things, such as standardize the naming scheme of a metric and enforce some automatic labeling. The labels applied through the helper could do anything from identify which Kubernetes Node ran the batch job to which engineer or project the job belonged to.
Creating an Actual Metric
Now that we have a basic, shareable module, an ML Engineer just needs to do something like this, and everything should just work.
from my_metrics_lib import generate_push_metric

TRAINING_SUMMARY = generate_push_metric(
  "Summary", "training_summary", "Time spent on training."
)
This, however, isn’t enough to actually start moving data to Pushgateway — we still need to generate the actual data! This introduces another complication of metricizing batch processes rather than long-lived services — the Prometheus Python library doesn’t have a direct helper utility for generating something like elapsed time for Pushgateway metrics. No problem, we just added one to the helper library.
def summary_timer(summary):
      """Decorator for timing functions using Pushgateway.

      Args:
          summary (prometheus_client.Summary): Summary to update and push.

      Returns:
          func: Summary timer decorator.

      Example:
          @summary_timer(a_summary)
          def foobar(self):
              ... Some function logic that you want to time. ...
      """

      def decorator_summary_timer(callback):
          def timer(*args, **kwargs):
              start = default_timer()
              callback_result = callback(*args, **kwargs)
              end = default_timer()

              # Push metrics. Account for potential bad clock math.
              duration = max(end - start, 0)
              summary.labels(SOME_LABEL_VALUE).observe(duration)
              if PUSHGATEWAY_URL:
                  prometheus_client.push_to_gateway(
                      PUSHGATEWAY_URL,
                      job="my-ml-code-for-training",
                      registry=registry,
                      handler=insecure_ssl_pushgateway_handler,
                  )
              else:
                  logging.warning("Pushgateway is not defined.")

              return callback_result
          return timer
      return decorator_summary_timer
Here, we defined a Python function decorator that would actually supply data to our metric about how long the decorated function took to execute, which also automatically pushed the data. A couple things to note here: we decided to only allow Summary type metrics, as they make sense for “elapsed time” forms of data, we had to supply actual, contextual data through the decorator or through global scope (like “SOME_LABEL_VALUE,” “PUSHGATEWAY_URL” and etc.), and finally we had to make sure we didn’t push negative time (in the spirit of not trusting clocks).
Now we’re in business, and we can expand on the developer code example to show a timed function.
from my_metrics_lib import generate_push_metric, summary_timer

TRAINING_SUMMARY = generate_push_metric(
  "Summary", "training_summary", "Time spent on training."                                        )

@summary_timer(TRAINING_SUMMARY)
def do_training_make_models():
    … money-making model training goes here …
After developing this library, engineers on our ML team were able to produce over a dozen summary timers from their functions, measuring everything from training time, inference, and even things like S3 upload and download time.
Will it Blend?
Once metrics collection went live, it was important to let the metrics collection bake for some amount of time; making sure that data was accumulating and looked reasonable and to iron out any wrinkles. Two problems stood out.
- The reliability-minded of you have probably noticed that the code so far made the classic mistake of introducing a dependency on an external service and not accounting for its possible failure. Very quickly we realized we were crashing our training code every time we took Prometheus or Pushgateway offline. Metrics are like logs: ideally ML code, or any code, is ultimately more valuable than its measurement and should happily chug along even if it can’t record a metric.
- Our Pushgateway server is behind HTTPS (which is good) but it’s using a certificate that’s signed by a CA not in the standard collection, which caused the Prometheus Python libraries to not want to actually make a connection. Figuring out this issue was probably the most challenging, but after some guidance in the Prometheus issue queue, we were able to define a “handler” for the connection that would successfully connect.
The solution to both of these problems involved the same bit of code.
def insecure_ssl_pushgateway_handler(url, method, timeout, headers, data):
    """Defines a handler which manages unverified SSL connections.

    NOTE: This is used because client Python code will be addressing HTTPS endpoints that use TLS originating from
          PathAI's CA, which is not normally verifiable.

    Arguments are required by the handler interface in prometheus_client.push_to_gateway.

    See: https://github.com/prometheus/client_python/blob/master/prometheus_client/exposition.py#L259
    """

    def handler():
        try:
            # Disable SSL verification for the Pushgateway.
            ssl_context = ssl.create_default_context()
            ssl_context.check_hostname = False
            ssl_context.verify_mode = ssl.CERT_NONE
            ssl_handler = urllib.request.HTTPSHandler(context=ssl_context)

            # Largely copied from prometheus_client.exposition.default_handler.
            request = urllib.request.Request(url, data=data)
            request.get_method = lambda: method
            for k, v in headers:
                request.add_header(k, v)
            response = urllib.request.build_opener(ssl_handler).open(
                request, timeout=timeout
            )
            if response.getcode() >= 400:
                logging.warning("Pushgateway metrics push failed. {} {}").format(
                    response.geturl(), response.info()
                )
        except Exception as e:
            logging.warning("Pushgateway metrics push failed. Exception: {}".format(e))

    return handler
Here we actually copied a large chunk of the Prometheus Python client’s default handler and added some SSL manipulation, as well as a broad Exception catch for any metric that fails to write (logging a warning but preventing the program from stack tracing to death). Arguably we could have also solved the SSL problem more gracefully by manipulating system stored certs to add the root certificate.

Wrapping it Up
In this post, we started with the goal of wanting to make metrics generation and telemetry dead simple for engineers who would rather just explore data about their code and not have to think too hard about how to produce and present it. We looked at the technologies available to us within the Kubernetes ecosystem, adopted Prometheus and Grafana, and set up some straightforward helper code that knows how to ship metrics to Prometheus using Pushgateway. If you’re looking to solve the same type of problem, hopefully these examples are useful.
Does this sound like interesting work? PathAI is leveraging the latest in machine learning & computer vision toward one of the most important problems facing us all, the diagnosis & treatment of diseases like cancer. We’re currently about 600 employees, have raised over $250MM from top-tier investors, and are doing impactful work across life sciences, clinical practice, and global health.

